

Table of Contents
- What vertical and horizontal actually mean
- Reading a bar chart: which way do the bars go
- When to choose vertical bars
- When to choose horizontal bars
- The layout side: stacking versus rowing
- A step-by-step way to decide
- Mistakes that make either direction fail
- A note on real-world data and direction
- Vertical vs Horizontal FAQ[+]
Vertical means running up and down, like a column. Horizontal means running side to side, like a row. In charts, the difference decides whether your reader scans a label easily or tilts their head to read it. In layouts, it decides whether a page feels tall and calm or wide and busy.
Most confusion comes from one place. People mix up the axis with the bars. The bars point one way, the category labels sit on the other axis, and the value scale follows the direction in which the bars grow. Get that straight and the rest is simple.

What vertical and horizontal actually mean
Vertical is the up-and-down direction. Think of a wall, a door, a column of text. Horizontal is the side-to-side direction. Think of a shelf, a horizon, a line of text.
In a chart, the vertical axis is usually called the y-axis and runs from bottom to top. The horizontal axis is the x-axis and runs left to right. That naming holds across most software you will touch, from a spreadsheet to a design tool.
The words also carry a second meaning in layout work. A vertical layout stacks elements on top of each other. A horizontal layout places them in a row. Same idea, different surface.
One quick test settles it every time. Hold your hand flat and move it up and down. That is vertical. Move it left and right. That is horizontal.
Reading a bar chart: which way do the bars go
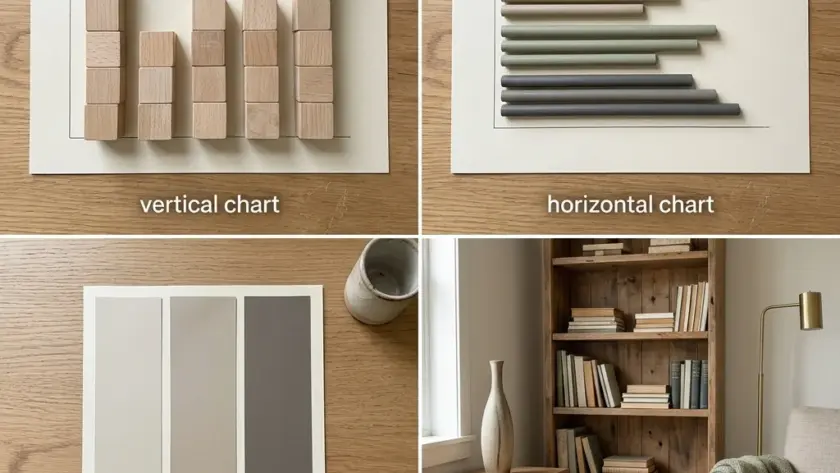
In a vertical bar chart, the bars stand up from a baseline at the bottom. Categories sit along the horizontal axis underneath, and the value scale runs up the vertical axis.
In a horizontal bar chart, the bars lie flat and grow to the right. Categories sit down the vertical axis on the left, and the value scale runs along the horizontal axis at the bottom.
So the bars and the category labels always sit on different axes. If your labels are underneath the bars, you have a vertical chart. If your labels are to the left of the bars, you have a horizontal one.
This is where many beginners trip. They see long bars and assume the chart is horizontal. But a vertical chart can have long bars too. The direction the bars grow identifies the chart type. Their length represents the values.
The bar chart itself has a long history. William Playfair (1759–1824) is credited by many sources with inventing it, and his graph covering Christmas 1780 to Christmas 1781 is considered the first bar chart in history. He later devised the bar graph technique for statistical measurements in his 1786 Commercial and Political Atlas. Proto bar charts appeared about 300 years before Playfair in The Latitude of Forms.
None of that changes how you read one today. But it helps to know the form was built for comparison from the start.
When to choose vertical bars
Vertical bars work best when your category labels are short. Months, years, single words, short codes. The reader scans along the bottom and the bars rise above each label.
They also suit time series. If you are showing sales by month or visitors by quarter, vertical bars read left to right in the same order people expect time to move.
Vertical bars are a poor fit when labels are long. A sentence-length category name under a narrow bar forces the reader to tilt their head or the software to rotate the text. Both slow reading down.
A histogram is a special case worth knowing. In a histogram each bar represents a number range, such as 150-200 cm. Each bar covers a range of values, and the ranges run in order. The bars usually stand vertically because the ranges run along the horizontal axis in order. Pearson noted in 1895 that the histogram’s graph type was already a common form of graphical representation, so the convention has had time to settle.

When to choose horizontal bars
Horizontal bars win whenever the labels are long. Country names, product titles, survey responses, job titles. The label sits to the left with room to breathe, and the bar grows to the right.
They also handle many categories better. A vertical chart with twenty categories gets cramped. A horizontal chart with twenty rows just gets taller, and the reader scrolls.
Ranking is another good use. If you want to show the biggest to the smallest, horizontal bars sorted top to bottom read like a leaderboard. The eye moves down the list and the lengths do the comparing.
A survey example makes the point. A mathsisfun survey about the nicest fruit included 145 people. With fruit names as categories, horizontal bars keep every label readable without rotation.
The trade-off is space. Horizontal bars need vertical room for each row. If your page is short and wide, vertical may fit better even when labels are long.
The layout side: stacking versus rowing
Charts get the attention, but layouts follow the same logic. A vertical layout stacks blocks down the page. Header, then hero, then content, then footer. This is the default for most websites because screens scroll down.
A horizontal layout places blocks side by side. Navigation bars, card rows, image galleries, pricing tables. It uses available width and needs vertical room for each row.
The choice comes down to what the reader does next. If they scroll and read in sequence, stack vertically. If they compare options at a glance, lay them out horizontally.
Mixing the two is normal. A page can have a horizontal navigation bar at the top and a vertical stack of articles below. The trick is to keep each section consistent so the reader is not re-learning the pattern every screen.
On mobile, horizontal layouts often collapse into vertical ones. A row of cards becomes a stack. That is a deliberate choice because narrow screens have little width to spare.
A step-by-step way to decide
Here is the procedure I use when a chart or layout is not obviously one or the other.
- Write out your category labels and count the characters in the longest one.
- Count how many categories you have.
- If the longest label is more than a couple of words, lean horizontal.
- If you have many categories, lean horizontal.
- If the categories are short and time-ordered, lean vertical.
- Check the space you have. Tall and narrow favours vertical, short and wide favours horizontal.
- Build a rough version both ways and look at them side by side before you commit.
That last step matters more than any rule. A quick sketch in a spreadsheet costs a minute and settles arguments faster than a long debate.
Mistakes that make either direction fail
The most common mistake is starting the value axis at something other than zero on a bar chart. Bars encode length, and a truncated axis exaggerates differences. Line charts can get away with a trimmed axis because they show change, but bars cannot.
The second is rotating labels to force a vertical chart when horizontal would have solved it. Rotated text is slower to read and looks like a workaround because it is one.
The third is mixing directions in one figure. A vertical bar chart next to a horizontal one in the same report makes the reader reset their eyes twice.
The fourth is ignoring the data itself. A histogram needs enough data to be meaningful. Sturges’s formula performs poorly when n < 30, producing fewer than seven bins, so small samples need care whichever way the bars point. The same formula's output is closest to Scott's and Terrell-Scott rules when n ≈ 100. Scott's normal reference rule uses a bin width formula with coefficient 3.49 times the sample standard deviation. These are technical details, but they decide whether your histogram says anything at all.
A worked example helps. The standard histogram example uses 500 items, and the cumulative histogram example uses a random sample of 10,000 points from a normal distribution. At those sizes the bin choice is stable and the direction of the bars is purely a reading question.

A note on real-world data and direction
Direction reaches beyond charts. It shows up in how we describe the world. The US Census Bureau found 124 million people work outside their homes, and that kind of figure is often shown as a single bar or a share, where the direction barely matters.
What matters is consistency. If your report uses vertical bars for one chart and horizontal for the next, the reader has to re-orient before every chart. Pick a convention and hold it across a document.
The same applies to layouts. A site that stacks content vertically on one page and rows it horizontally on the next feels unsettled, even when each page works alone.
If you are building something that depends on clear comparison, whether a chart or a page, the direction you choose is part of the message. It is worth treating it that way. The same discipline shows up in how to create a referral program that customers actually use, where clear structure decides whether people act.
For anyone weighing different ways to build and present an offer, the low-cost online business models compared by cost, speed, and skill are a useful reference for how layout choices shape perception.
And if you are juggling study and side projects, the guide on how to stay motivated during your final year of college is a reminder that clear structure beats raw effort.
Vertical vs Horizontal FAQ
Is a vertical bar chart the same as a column chart?
Yes, a vertical bar chart is what many tools call a column chart. The bars stand up from a baseline and the categories sit along the bottom. The name changes between software packages, but the reading is identical.
Which direction should I use for long category labels?
Horizontal. Long labels sit to the left of each bar with room to read, and the bars grow to the right. A vertical chart with long labels forces rotated text, which slows every reader down.
Does the axis direction change how I read the values?
No. The value scale always runs along the direction the bars grow. In a vertical chart it runs up the y-axis, and in a horizontal chart it runs along the x-axis. Use the scale to interpret the bar length.
Can I mix vertical and horizontal charts in one report?
You can, but it costs the reader. Each switch forces them to re-orient. Pick one convention for a document and keep it unless a specific chart genuinely needs the other direction.
What is the difference between vertical and horizontal in page layout?
Vertical layout stacks blocks down the page, which suits scrolling and reading in sequence. Horizontal layout places blocks in a row, which suits comparison at a glance, such as navigation bars and card rows.
Thank you for reading!